Imputation
for Nonresponse in Surveys

PUBHBIO 7225 Lecture 19

Generative AI acknowledgment: Google Gemini was used to generate alt text for some images

Outline

Topics

  • What is imputation?

  • When and why would we impute?

  • Overview of some imputation methods

    • Hot Deck Imputation

    • Sequential Regression Imputation

  • Single vs Multiple imputation

Activities

  • 19.1: Exploring Imputation

Readings

  • OPTIONAL: Andridge, R.R. and Little, R.J., 2010. A review of hot deck imputation for survey non-response. International Statistical Review, 78(1), pp.40-64. (PDF on Carmen)

Assignments

  • Group Progress Report 3 due Thursday 11/6/2025 11:59pm via Carmen

What is Imputation?

Imputation = filling in missing data values (in a principled way) to create a “complete” data set

Y Z
15 11
25 13
10
13 8
13 7
9
16 10
20 13
21 10
8

Y Z
15 11
25 13
20 10
13 8
13 7
13 9
16 10
20 13
21 10
15 8
  • Important point:

    • The goal of imputation is not to perfectly replicate the data value that would have been observed

    • The goal of imputation is to replace missing values by “plausible” values in order to make use of all available information (i.e., other info we have about a survey respondent) so that population inference is improved (relative to discarding missing data)

When and Why We Impute (in sample surveys)

  • Imputation is used across many application areas

  • General benefits of imputation:

    • Potential for gain in efficiency relative to complete case

    • Potential for reduction in nonresponse bias relative to complete case

  • In general:
    • Imputation is for item nonresponse
    • Weighting adjustments are for unit nonresponse
  • For complex sample surveys, the two most common reasons for imputing are:

    1. There is missing data on variables collected on the survey that will be used for weight adjustments (post-stratification, raking, etc.)

    2. Key survey outcomes have missingness and we don’t want different analysts to get different answers

  • Generally speaking, imputation for both of these reasons will be done by the survey producers (e.g., CDC) and the imputed data is provided to secondary data analysts (often with imputation “flags” so you know which values have been imputed)

Examples of Imputation in Large Scale U.S. Surveys

  • Census Household Pulse Survey

    • Items imputed: age, sex, Hispanic origin, race, educational attainment

    • Why: variables needed for post-survey weight adjustments (raking)

  • National Survey of Children’s Health (NSCH)

    • Items imputed: household tenure, child’s sex, child’s race, child’s hispanic origin, adult 1’s education, household size, family poverty ratio

    • Why: variables used for post-survey weight adjustments (raking)

  • National Immunization Survey - Child

    • Items imputed: sex, Hispanic origin, race, health insurance status, and first-born status of the child; education level, age group, marital status, and mobility status of the mother; income-to-poverty ratio of the household

    • Why: variables used for post-survey weight adjustments (raking)

Imputed Items Tend to Have Low Nonresponse Rates

  • Demographic variables are the most commonly imputed (for use in weight adjustments)

  • Item nonresponse for these items tends to be low

  • Example: National Survey of Children’s Health (NSCH) – 2022

A table titled 'Table 15. Imputed Variables and Their Imputation Flags' shows a list of variables from the National Survey of Children's Health (NSCH) dataset that were imputed. The table has three columns: Variable, Missing Rate, and Imputation Flag Variable. The Variable column lists the characteristic and variable name for each imputed variable, such as 'Household tenure (TENURE)' and 'Child's sex (C_SEX).' The Missing Rate column shows the percentage of missing data for each variable. For example, 'Household tenure' has a 1.45% missing rate, while 'Family poverty ratio (FPL) has the highest rate at 19.53%. The Imputation Flag Variable column lists the corresponding flag variable for each variable, such as 'Flag for Household Tenure (TENURE_IF),' which indicates whether the data for that variable has been imputed.

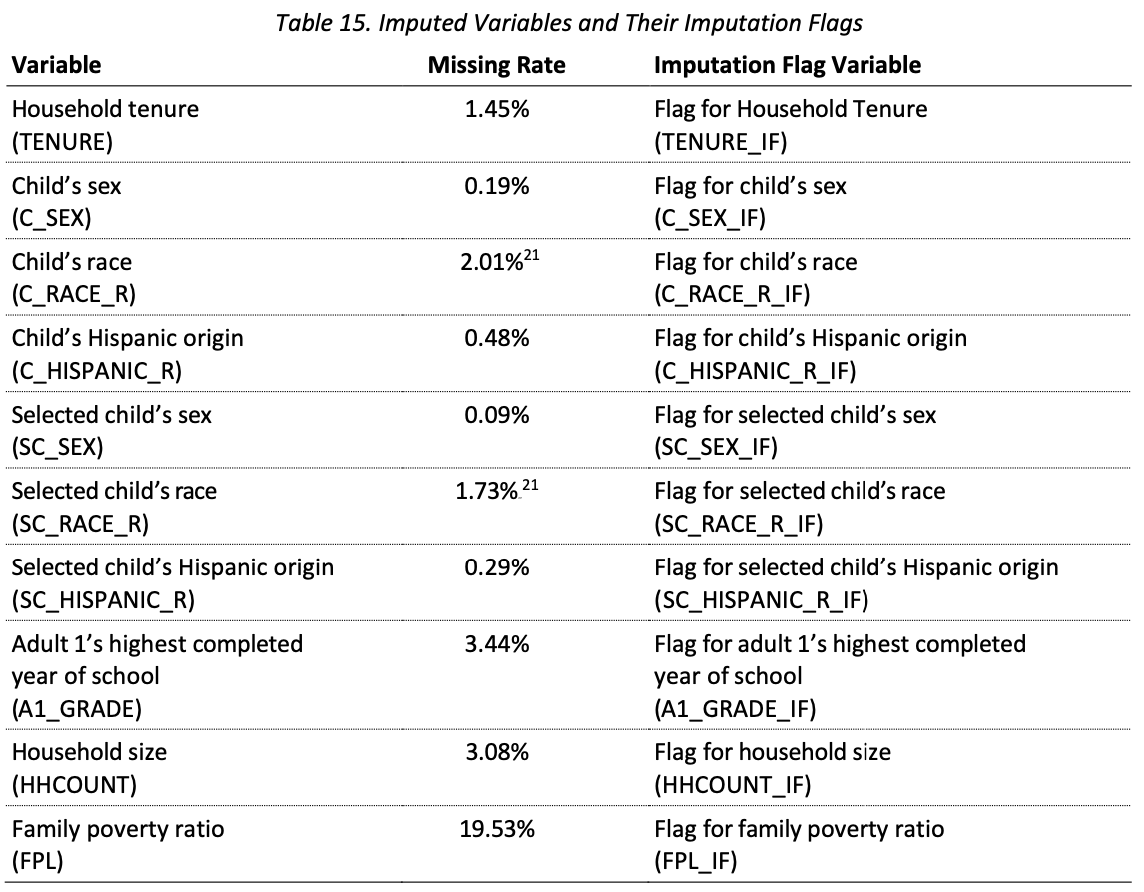
  • Screener sample size = 127,726

    • Most missingness: Child’s race – 2,568 missing (2.01%)
  • Topical survey sample size = 54,103

    • Most missingness: Poverty ratio – 10,567 missing (19.53%)

    • Next most missingness: Adult education – 1,860 missing (3.44%)

  • Very low rates of missingness for all demographics except poverty level

  • Poverty level based on income – usually high nonresponse for income on all surveys!

Source: 2022 NSCH Methodology Report, p.40
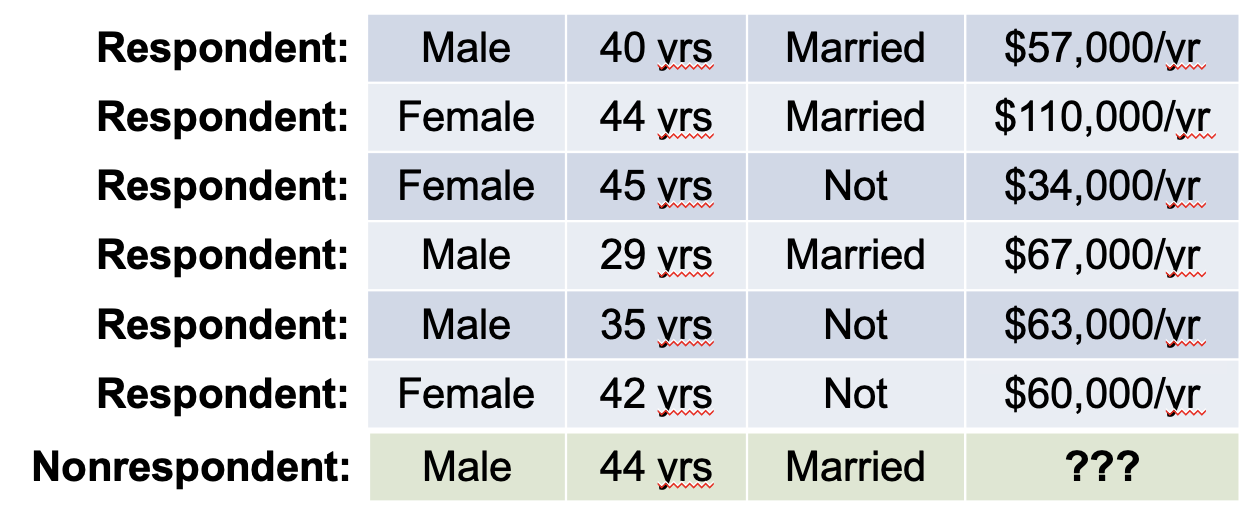
Some Common Imputation Methods (for sample surveys)

  • There are a lot (a semester’s worth) of imputation methods – here are just two:

Hot Deck Imputation

Sequential Regression Imputation

Hot Deck Imputation

Hot Deck Imputation = Replacing missing values of one or more variables for a nonrespondent (“recipient”) with observed values from a respondent (“donor”) that is similar with respect to characteristics observed for both
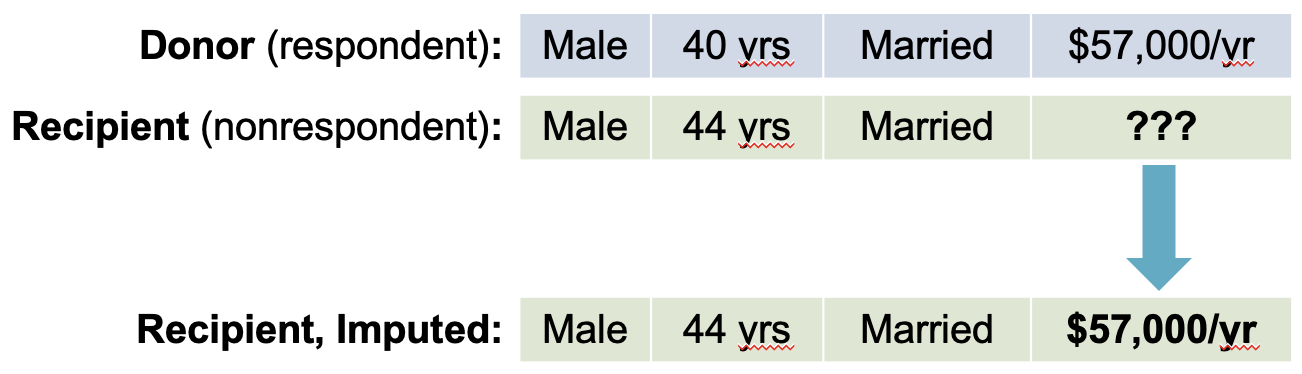
An illustration of hot deck imputation where a missing value from a recipient is replaced with a value from a similar donor. The image shows a male, 44-year-old, married recipient with a missing income value. The missing value is filled in with the income of a similar donor: a male, 40-year-old, married person with an income of $57,000/yr. The imputed income for the recipient becomes $57,000/yr.

  • Why is it “Hot”?

    • Throwback to punch cards for computers

    • Donors come from cards currently being processed (“hot”)

    • Alternative: “Cold” deck = data from external data set

A pair of old-fashioned data punch cards, with a fire emoji above them. The card in the foreground is a standard, beige-colored IBM 80-column card, with columns of numbers and punched holes. A smaller, pink card is behind it.

Basic Steps of the Hot Deck

  1. Identify possible donors: Create set of possible donor(s) for each recipient

  2. Select a donor: Select a single donor for each recipient

  3. Impute: Use donor’s observed value(s) to fill in recipient’s missing value(s)

  • Example: 2017 Ohio Medicaid Assessment Survey (link)

    • 25 variables imputed one at a time using hot deck imputation1

      • Impute region based on phone type
      • Impute adult gender based on (imputed) phone type and region
      • Impute adult race based on (imputed) phone type and region and adult gender

Sequential Regression Imputation

(the sometimes-used imputation method for surveys)

Sequential Regression Imputation = Replacing missing values of one or more variables for a nonrespondent with a draw from a predictive distribution that is based on a regression model

An illustration of a dataset with missing data. The top of the image shows six respondents with complete data (demographics and income). The bottom shows a nonrespondent with a missing income value.
  • To impute missing income value:

    1. Predict income using gender, age, and marital status as covariates in regression model

    2. Obtain prediction for the nonrespondent’s income based on the model

    3. Add extra “noise” to both the regression coefficients and the imputed value

  • This is a simplification of a complex process!

Imputation Is Complex!

  • Lots and lots of possible methods…

  • Added complexity of different patterns of missing data:

An illustration of a dataset with univariate missing data. The dataset is represented by a grid of rows and columns. The columns are labeled Y1, Y2, Y3, and Y4. The cells in the first three columns, Y1, Y2, and Y3, are filled. The cells in the fourth column, Y4, are partially missing, indicated by a shaded pattern and question marks in the bottom half of the column. This shows that data is only missing for a single variable, Y4. An illustration of a dataset with unit nonresponse. The dataset is a grid of rows and columns, with the columns labeled Y1, Y2, Y3, and Y4. The cells in the first two columns, Y1 and Y2, are filled. The cells in the last two columns, Y3 and Y4, are completely missing for the bottom half of the dataset, indicated by a shaded pattern and question marks. This shows that all data for a specific set of records (rows) is entirely missing. An illustration of a dataset with monotone missing data. The dataset is a grid of rows and columns, with the columns labeled Y1, Y2, Y3, and Y4. The missing data forms a staircase or stepped pattern. Specifically, data is missing in column Y4 for the bottom rows. Then, for a lower set of rows, data is missing in both columns Y3 and Y4. Finally, for the very bottom rows, data is missing across columns Y2, Y3, and Y4. The missing cells are indicated by a shaded pattern and question marks. This pattern suggests that if a value is missing for a particular variable, all subsequent variables for that same record (row) are also missing. An illustration of a dataset with a swiss cheese missing data pattern. The dataset is a grid of rows and columns, with the columns labeled Y1, Y2, Y3, and Y4. The missing cells, indicated by a shaded pattern and question marks, are scattered randomly throughout the dataset, much like the holes in a block of Swiss cheese. This contrasts with a monotone pattern where the missing data forms a stepped or triangular shape.

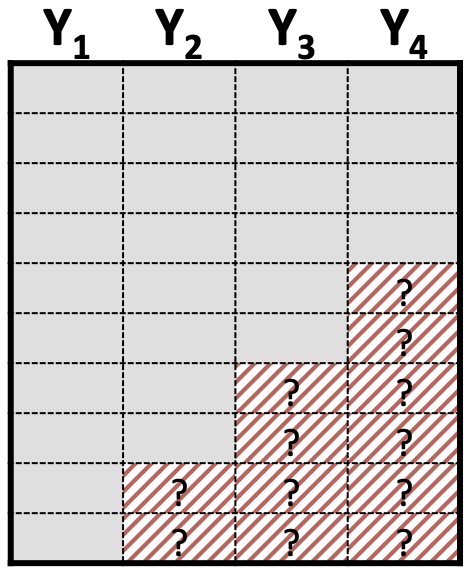
  • Want to know more about missing data and imputation?
  • We have a whole course: PUBHBIO 7240/STAT 6520 (Applied Statistical Analysis with Missing Data)

Activity 19.1

Exploring Imputation

What You Just Did: Single Imputation

Single Imputation: Replace each missing value with one value

  • Create one completed data set
  • Analyze that one data set as usual

  • Each missing income value was replaced with one value

  • But, when you analyzed the imputed data, you were effectively treating the imputed data as if it had been actually observed!

  • Look at the class results… what do we see about the estimated precision (SEs) for the data sets with imputed data compared to the “oracle” data?

  • No “penalty” for the fact that we imputed instead of observed some values — but shouldn’t there be?

Single vs Multiple Imputation

Multiple Imputation: Replace each missing value with multiple values

  • Create multiple completed data sets

  • Analyze each data set separatedly and combine the resulting estimates using special combining rules (“Rubin’s Rules”)

  • Resulting inference properly treats the imputed data not as if it were known1

  • Multiple imputation more often used with non-probability/convenience samples (e.g., observational studies, clinical trials)

  • Applying multiple imputation in survey context is (more) complicated — have to properly account for the sample design

  • Some publicly available surveys do release multiply imputed data — most often income data (e.g., NSCH, NHIS) — why might this be?